See the air, heat and gas your people work in.
OctosX monitors indoor air, outdoor work-site weather and gas at confined-space entries around the clock. When a reading crosses a line you set, the right people hear about it, and every reading, alert and response stays on record.
What your EHS team sees.
One screen per site: every zone, every factor, the levels crossed, and where to look first.
Screens are configured per site during commissioning. Levels are set with your team.
Between rounds
Rounds catch a moment. The air changes all shift.
What gets monitored, and what happens when it changes.
Three settings, one console: indoor air, the outdoor work site, and confined-space entries.
Indoor air
Indoor air example. Factors monitored: temperature, humidity, CO2, PM2.5, PM10, formaldehyde (HCHO), TVOC, CO and ozone. In the example, PM2.5 near machining line 2 starts to rise in the mid-morning. A rate-of-rise flag fires first, at 10:05, then the 10:12 sample is the first above the advisory level set for that zone, at 38 µg/m³; the reading holds there and starts to fall back, staying below the warning level (example levels; levels are set per site). The alert names the zone and sensor, the reading and the time of first detection. It goes to the dashboard, email and SMS; a floor display, an integration confirmed per project, takes warning and critical alerts only. The line lead acknowledges the alert at 10:19; every reading, alert and acknowledgment is time-stamped and exportable.
Outdoor site
Outdoor site example. Factors monitored: temperature, humidity, heat index level, noise, wind speed, wind direction and rain. The heat index is worked out from temperature and humidity and shown as a level from 1 to 4; it does not account for radiant heat, direct sun or air movement, and your heat plan decides what each level means. In the example, the heat index in yard B climbs from level 1 to level 3 over the early afternoon: a rate-of-rise flag fires at 13:10, and the reading reaches level 3 at 13:40. The alert reaches the dashboard, then SMS to the supervisor, and can be shown on a floor display, an integration confirmed per project. The yard supervisor acknowledges the alert at 13:44, and every step is time-stamped.
Confined space
Confined space example. Fixed detectors at a tank entry monitor oxygen, methane, carbon monoxide and hydrogen sulphide. The detectors are not explosion-proof, are not for hazardous (classified) locations, and do not replace portable gas monitors or your confined-space entry procedure. In the example, hydrogen sulphide rises and falls during work at the entry, peaking at 3.4 ppm at 10:22, and stays below alarm 1, which is set per site; oxygen, methane and carbon monoxide stay in their normal ranges. No alarm is raised, so nothing is escalated to the attendant, the supervisor or the control room. Every reading is time-stamped.
Where does this afternoon sit?
Drag the dot, or pick a moment, and see the heat index level change.
Open the heat index explorer
Heat index Level 3Example bands; your heat plan sets the levels.
Heat index is worked out from temperature and humidity and shown as a level, so supervisors can apply their own heat plan. It doesn't account for radiant heat, direct sun or air movement. Near furnaces or in full sun, your heat plan may call for other methods.
Three kinds of sensing, one record.
Nodes on the wall read the air inside, a weather mast reads the yard, and fixed detectors watch confined-space entries. Every reading lands in one time-stamped record.
Inside the sensors · 3D
What each sensor reads, part by part.
- 00The indoor air node
A slim node that hangs on a wall or column in the space it watches. Factors are chosen per site from temperature, humidity, PM2.5, PM10, CO₂, TVOC, HCHO, CO and O₃.
- 01Three indicator lights
Green shows power, blue shows the data link, and red lights up when a reading passes the level set for it.
- 02Wall bracket
The node hooks onto its own wall bracket, fixed with screws. A clip underneath releases it when it needs to come down.
- 03One record
Its readings join the same time-stamped record as the yard mast and the confined-space detectors.
- 00The weather station
Clamps to a pole in the yard or at a roof edge and reads the conditions outdoor crews work in: temperature, humidity, wind speed and direction, rain and noise. Temperature and humidity also give the heat index level.
- 01Wind speed
A cup anemometer on the left of the arm turns with the wind.
- 02Wind direction
A vane on the right of the arm swings to point into the wind.
- 03Pole bracket
A bracket at the centre holds the station to a pole or lamp post with two stainless steel bands.
- 04Enclosure
The enclosure under the arm opens on hinges and closes with latches; cables enter through glands underneath.
- 05One record
Its readings join the same time-stamped record as the indoor nodes and the confined-space detectors.
The result · what rounds miss
Same shift, two records.
A chart of CO2 in a packing hall over one shift, from 06:00 to 14:00, next to the two records that shift produces. Rounds were taken at 08:00, reading 740 ppm, and at 12:00, reading 770 ppm; both were below the site's advisory level of 1,000 ppm, so the rounds log shows a clear shift. The continuous sensor shows CO2 crossing the advisory level at 09:48, peaking at 1,360 ppm at 10:18 and falling back below at 10:45: 57 minutes above advisory, all between the two rounds. Example levels; levels are set per site.
Rounds catch a moment. The sensor keeps the whole shift, so a peak between rounds is on the record, with when it started and how long it lasted.
Four steps from floor plan to live alerts.
Map the zones. Mount the sensors. Set the levels. Go live.
- Zones
- Per floor plan
- Mount
- Wall, column, mast, entry point
- Gas detectors
- Not explosion-proof
- Levels
- Set with your team
- Network
- Per site
Typical deployment. Each site is scoped individually.
Deployment runs in four steps: map the zones, mount the sensors, set the levels, go live.
- Map. The site floor plan is drawn up and divided into zones: indoor areas such as a machining hall and a packing hall, an outdoor yard, and confined-space entries such as a tank.
- Install. Air nodes mount on walls or columns in the indoor zones, a weather station mounts on a pole in the yard, and a fixed detector mounts at the tank entry. The gas detectors are not explosion-proof, are not for hazardous (classified) locations, and do not replace portable gas monitors or your confined-space entry procedure. Each sensor reports in over a network set up for the site.
- Set levels. Advisory and warning levels are set for each zone and factor with your team. Heat index levels follow your heat plan, and gas alarm levels come from your safety program.
- Live. The dashboard goes live. In the example, PM2.5 in the machining hall passes the advisory level at 10:12 and stays below the warning level; the advisory alert goes to the supervisor and EHS. A floor display, where it is part of the project, takes warning and critical alerts only, so it stays dark for this one.
An environment summary you can hand to someone.
Coverage by zone, findings with the readings behind them, documented limitations, and a next step for each. Switch to the quiet day to see a report when nothing crossed a line.
Open the sample environment summary
Hot afternoon
North Plant · Day shift
- Zones in this summary
- 4
- Sensors reporting
- 6 of 6
- Data
- Complete for the shift
- Open findings
- 2
Readings are values for the area where each sensor sits, not personal exposure. Heat index is worked out from temperature and humidity and does not include radiant heat, direct sun or air movement.
Findings — 2 open items, 1 noted
Heat index in Yard B climbed from Level 1 to Level 3 over the early afternoon, reaching Level 3 at 13:40 and staying there until 15:20. The Level 3 alert went to the yard supervisor, who acknowledged it at 13:44.
PM2.5 near line 2 began rising at 10:05; the 10:12 reading, 38 µg/m³, was the first above the advisory level and the peak. It held there, then fell back, staying above advisory for 25 minutes in all and below the warning level. The line lead acknowledged the alert at 10:19. The period lines up with grinding on line 2 recorded in the shift log.
During work at the entry, H₂S at the tank entry rose and fell, peaking at 3.4 ppm at 10:22. O₂, CH₄, CO and H₂S stayed below Alarm 1 for the whole shift, so no alert was sent. The detector is fixed and not explosion-proof; it does not replace portable gas monitors or your confined-space entry procedure.
Every finding shows the readings behind it, when it was first detected and who acknowledged it.
Quiet day
North Plant · Day shift
- Zones in this summary
- 4
- Sensors reporting
- 6 of 6
- Data
- 1 gap, flagged
- Open findings
- 0
Readings are values for the area where each sensor sits, not personal exposure. Heat index is worked out from temperature and humidity and does not include radiant heat, direct sun or air movement. A gap in data is shown as a gap, not filled in.
Findings — no levels crossed
All four zones stayed below their advisory levels for the whole shift, and heat index in Yard B peaked at Level 1. Because the record is complete apart from one flagged gap, a quiet day is documented rather than assumed.
PKG-P1 did not report between 09:20 and 09:55. The gap is flagged as missing data rather than treated as a normal reading; the node resumed on its own.
Every finding shows the readings behind it, when it was first detected and who acknowledged it.
For the people who answer for conditions on site.
-
EHS & safety
A record of conditions, shift by shift.
Every zone is covered and every shift leaves a time-stamped record of readings, levels crossed and acknowledgments that EHS can review and export. The animation shows four zones on a site plan, machining, packing, yard and tank, each checked off while a shift record fills in entry by entry: 06:00, an advisory at 10:12, a heat index level at 13:40, and the shift closed at 18:00.
-
Facilities & engineering
Which zone, which factor, since when.
An alert names the zone, the factor and when it started, so the team knows where to look and what to check. The animation shows one zone on a site plan changing colour, a PM2.5 tag with its rising trend and the time it crossed the advisory level, 10:12, then a technician going to the zone; after the work, the zone returns to normal. People handle the follow-up; nothing is adjusted automatically.
-
Site supervisors
The heat level, where the crew can see it.
Supervisors see the heat index level as it changes and can share it with the crew on a floor display, where a display is part of the project; what each level means is set by your heat plan. The animation shows the sun crossing the afternoon, a heat index meter climbing from level 1 to level 3, and a display board above three workers showing HEAT INDEX L3.
Where it fits on a factory site.
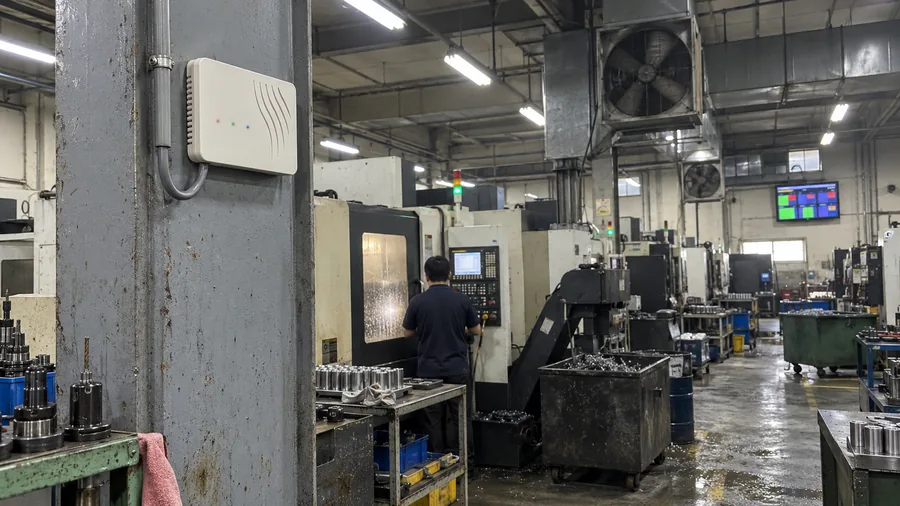
- PM2.5
- PM10
Machining & grinding halls
Dust and mist by zone near cutting and grinding lines. The trend shows where and when extraction falls behind.
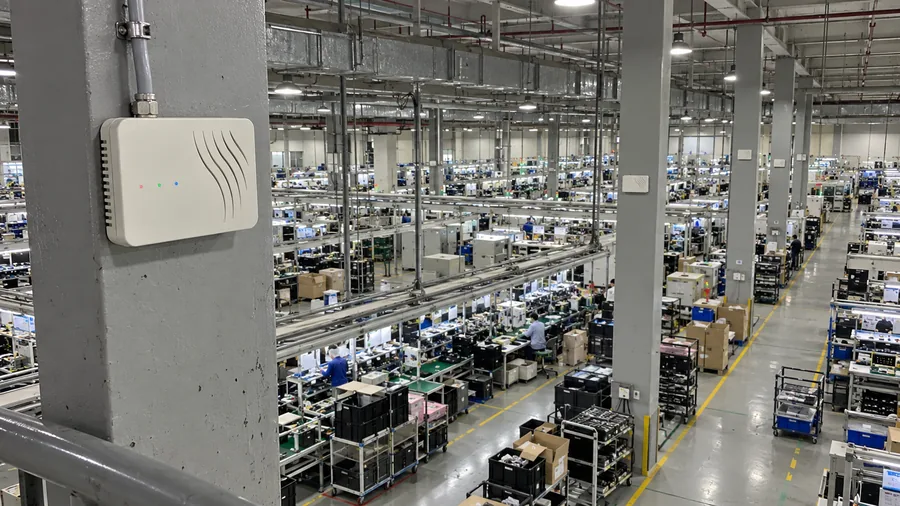
- Temperature
- Humidity
- CO₂
- PM2.5
Large production floors
Many points across one floor: temperature, humidity, CO₂ and particles on one map, one record.
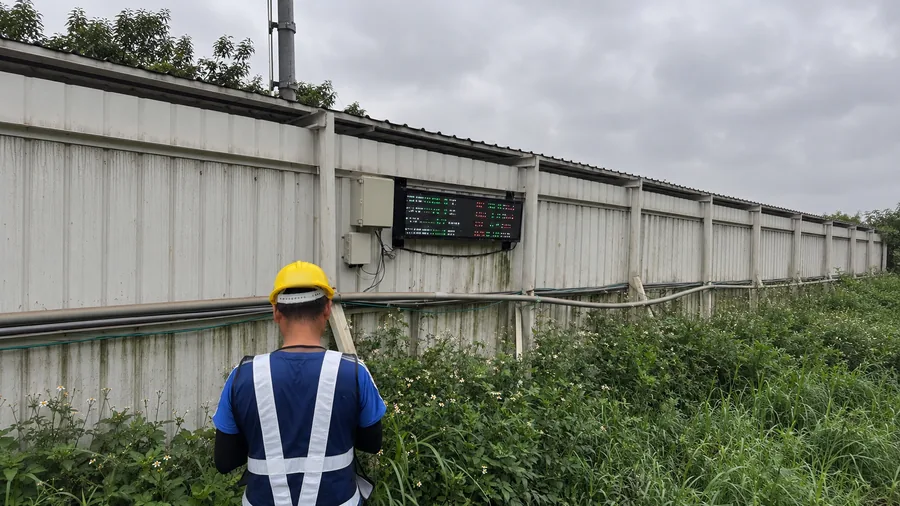
- Heat index
- Wind
- Rain
Outdoor yards & construction areas
Heat index level, wind and rain on the dashboard, and on a floor board where one is part of the project.
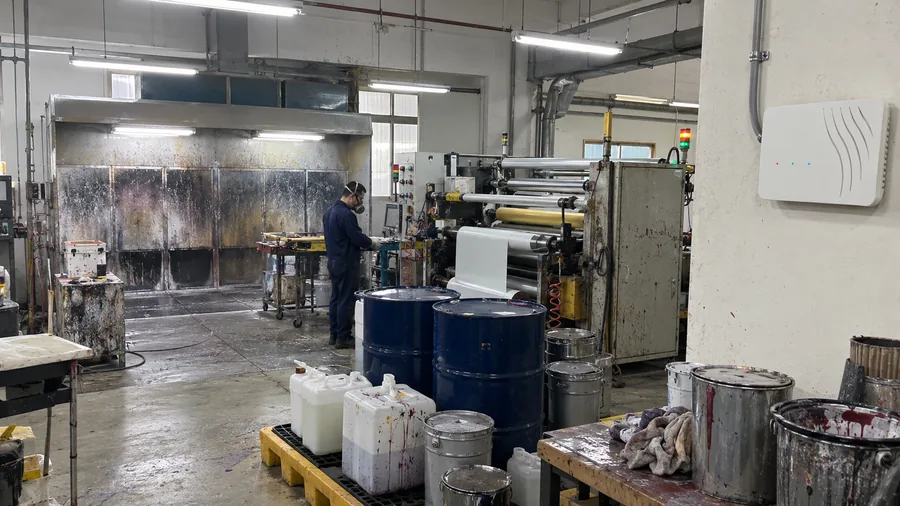
- TVOC
- HCHO
Paint, print & adhesive rooms
Solvent vapour from coatings, inks and adhesives, room by room and shift by shift, on the same record as the rest of the site. Nodes mount outside hazardous (classified) areas; they are not explosion-proof.
Confined spaces · tanks, pits, sumps and manholes. Fixed O₂, CH₄, CO and H₂S monitoring at the entry, with readings sent to the control room. Not explosion-proof; not for hazardous (classified) locations; does not replace portable gas monitors or your confined-space entry procedure.
See what's in the air where your people work.
Tell us about the zones that worry you most. We'll reply with how the sensors, the alerts and a sample summary would apply to them.