Continuous condition monitoring for pumps, motors and pipework.
OctosX monitors pressure, flow, leak zones, machine current and power, and vibration between inspection rounds. When a reading leaves its normal band, the right person gets an alert with the trend behind it, and the event is recorded.
What your maintenance team sees.
One screen per site: which machines moved off their baseline, which leak zones are wet, and what to check first.
Screens are configured per site during commissioning. Baselines and bands are set with your team.
Between rounds
Most changes happen when no one is standing there.
What gets monitored, and what happens when something changes.
Signals are read where changes show first: bearings, discharge lines, the floor under the skid.
One pump set, one change, on a night shift with nobody on the floor. The signals watched are suction and discharge pressure and flow on the pipework, two leak zones on the floor, and supply current, power, drive-end and non-drive-end vibration and motor temperature on the machine. In the example, overall vibration on the drive-end bearing of pump P-104 starts to drift up from its baseline of 2.8 mm/s. A rate-of-change flag fires first, then the reading passes the advisory, warning and critical levels set for that asset (example levels; levels are set per asset). Motor temperature and supply current rise at the same time, so the alert notes them as related signals moving together. The alert names the asset, the reading, the change against its baseline and the time first detected. Escalation runs from the dashboard to email, SMS and the on-call engineer. A floor display, where it is part of the project, is set to show leak and pressure alerts, so it stays dark for this vibration alert. A person acknowledges the alert; every reading, alert and acknowledgment is time-stamped and exportable.
Where would you set the band?
Drag the low and high limits on this pressure trace and watch the alerts change. Pressure is a range, not a ceiling.
Open the pressure band simulator
2 alerts in 24 h
- Below low · min 3.52 bar
- Above high · max 4.91 bar
Use the arrow keys on a limit for 0.1 bar steps.
Example trace on an example loop. The night dip and the afternoon peak are both outside the band; a single upper limit would miss the dip. Bands are set with your team for each asset.
Pressure, flow and the floor tell one story.
A weeping joint shows up three ways: pressure eases, flow shifts, water reaches the floor. Reading all three makes the change easier to see.
Inside a pump set · 3D
Where each signal is read, and what it shows.
- 00The pump set
A pump and its motor on one baseplate. Signals are read where changes show first; which ones are fitted is confirmed per project.
- 01Suction and discharge pressure
Pressure on both sides of the pump, read against a band with a low and a high limit, not a single ceiling.
- 02Flow
Flow on the discharge run, read next to pressure: pressure falling while flow holds means something different from both falling together.
- 03Leak cable in two zones
A leak-detection cable on the floor around the skid, split into zones. A wet zone is reported by name.
- 04Supply current and power
Read on the motor’s supply. The load trend shows when the set runs and how hard it is working.
- 05Vibration at both bearing ends
Overall vibration at the drive end and the non-drive end, kept as a trend against each point’s own baseline.
- 06Motor surface temperature
Frame temperature, read next to vibration and current so a change can be seen in context.
- 00A running motor
The fan behind the grille turns while the set runs. Vibration is read as one overall value per point.
- 01Drive end
Radial and axial, next to the coupling. Here it is steady, close to its baseline.
- 02Non-drive end
The same reading at the fan end, with its own baseline.
- 03Against its own baseline
Each point is compared with how it normally runs, so a slow drift shows in the trend even when no single reading looks unusual.
- 00Two zones around the skid
One cable, split into zone A on the motor side and zone B on the pump side.
- 01A joint weeps
A flanged joint on the suction line starts to drip onto the floor.
- 02Zone B reports wet
The water reaches the cable and zone B reports wet. Zone A stays dry, so the alert says where to look.
The result · what rounds miss
Same machine, two records.
A chart of discharge pressure on line CW-L1 over one night, from 22:00 to 06:00, next to the two records that night produces. Rounds were taken at 23:00, reading 4.12 bar, and at 05:00, reading 4.15 bar; both were inside the band, so the rounds log shows a quiet night. The continuous sensor shows pressure dropping below the low limit of 3.8 bar at 02:35, reaching 3.52 bar at 03:05 and recovering at 03:40: 65 minutes below the band, all between the two rounds. Example levels; bands are set per asset.
Round readings show the moments someone was there. A continuous trend shows the rest, with when a change started and how long it lasted.
Four steps from walk-down to live alerts.
Mapped to your equipment. Bands set from its normal running.
- Signals
- Pressure, flow, leak, power, vibration, motor temp
- Fit
- To existing equipment, method per site
- Leak cable
- Zoned, per floor plan
- Bands
- Per running state
- Network
- Per site
Typical deployment. Each site is scoped individually.
Deployment runs in four steps: assess, install, set the baseline, go live.
- Assess. A walk-down of the pump room maps the piping, two pump sets, P-104 and P-105, and the floor around them, and marks where each signal will be read: suction and discharge pressure, flow on the discharge header, vibration and supply current at the motors, and a leak zone on the floor around each skid.
- Install. The measurement points are fitted to the existing equipment, the leak-detection cable is laid in zones around each skid, and every point reports in over a network set up for the site.
- Baseline. For each signal, a band is set with your team from how the equipment normally runs, with a different band for each running state, such as standby and running.
- Live. The dashboard goes live. In the example, discharge pressure on P-104 drops below its band while the pump is running; the alert goes to maintenance and the facilities manager and, where a floor display is part of the project, to the floor board.
A condition summary you can hand to someone.
Coverage, findings with the trend behind them, documented limitations and a suggested next step for each. Switch to the quiet week to see how it reads when nothing changed.
Open the sample condition summary
Event week
North Plant · Pump room
- Assets monitored
- 24
- Signals reporting
- 24 of 24
- Data
- Complete for the week
- Open findings
- 3
Readings show the condition of each asset at the points where sensors are fitted, against bands set with your team. They do not predict remaining life or a failure date, and the system does not stop equipment or close valves.
Findings — 3 open items
The leak cable in zone B reported wet at 02:47, three minutes after discharge pressure on CW-L1 eased and flow shifted. It reported dry again at 04:15, after the joint was attended. Zone A stayed dry throughout.
Overall vibration at the drive end began rising faster than usual at 02:28 and passed the Critical level at 02:54. Motor temperature and supply current rose over the same period, so the three signals point to the same change. The trend shows that the condition changed; it does not say why.
Pressure dropped below the low limit overnight and rose above the high limit in the afternoon. Neither round reading that day fell inside either period.
Every finding shows the readings behind it, when it was first detected and who acknowledged it.
Quiet week
North Plant · Pump room
- Assets monitored
- 24
- Signals reporting
- 24 of 24 now
- Data
- 2 gaps, flagged
- Open findings
- 0
Readings show the condition of each asset at the points where sensors are fitted, against bands set with your team. They do not predict remaining life or a failure date, and the system does not stop equipment or close valves. A gap in data is shown as a gap, not filled in.
Findings — no bands crossed, 1 data-quality item
FL-104 (flow) and P-201 (vibration, non-drive end) each stopped reporting for a period. Both gaps are shown as no data, not as normal readings, and both points are reporting again. No band was crossed on the points that did report.
Every finding shows the readings behind it, when it was first detected and who acknowledged it.
For the people who keep equipment running.
-
Maintenance
Go to the machine that changed.
A change on one machine moves it to the front of the round, so maintenance goes there first. The animation shows four pumps on a round, one of them, P-104, flagged by a change in its readings; the route is redrawn to reach it first, and the work order lists P-104 first and is ticked off once it has been checked.
-
Facilities
Know about the leak before the floor does.
A leak alert names the zone and the time, so facilities can deal with it before water spreads across the floor. The animation shows the leak cable around a pump skid in two zones; zone B turns wet, a phone shows the alert, Leak, zone B, at 02:47, and a person goes to the zone to deal with it. People handle the follow-up; nothing is switched off automatically.
-
Equipment managers
See which assets need attention this week.
A weekly view of which assets need attention, with the trend behind each one. The animation shows a list of pumps, each with a small trend line; the trend for P-104 starts to rise, P-104 moves up into This week, and the item is ticked off at the weekly review.
Where condition monitoring fits.
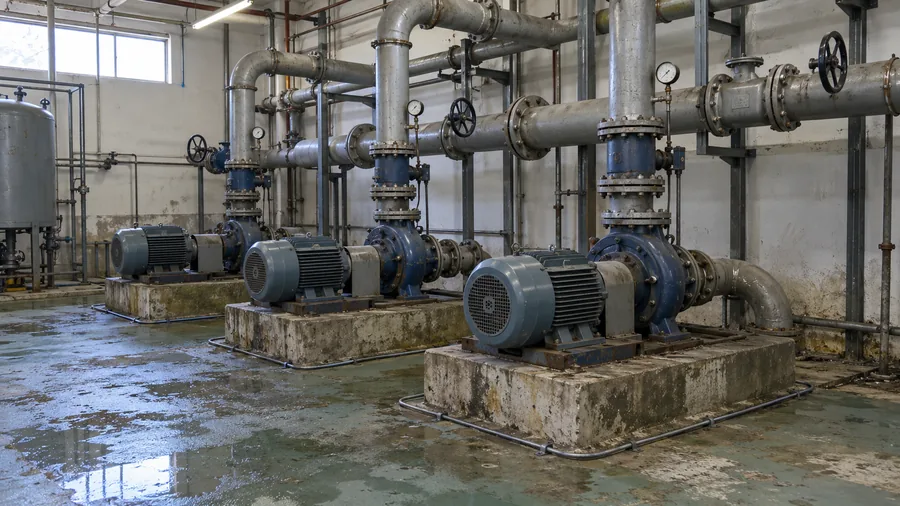
- Pressure
- Flow
- Leak zones
Cooling water & utility pumps
Pumps that run day and night with no one standing by. Pressure against its band, flow alongside it, and a leak cable around each skid.
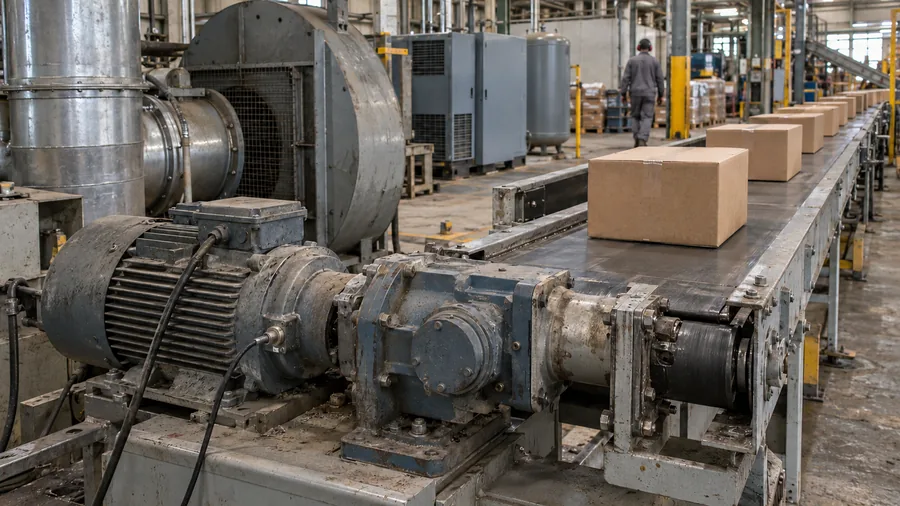
- Vibration
- Motor temp
- Current
Motors that run every shift
Conveyors, fans and compressors. Each motor is read against its own baseline, so a slow drift shows up between rounds.
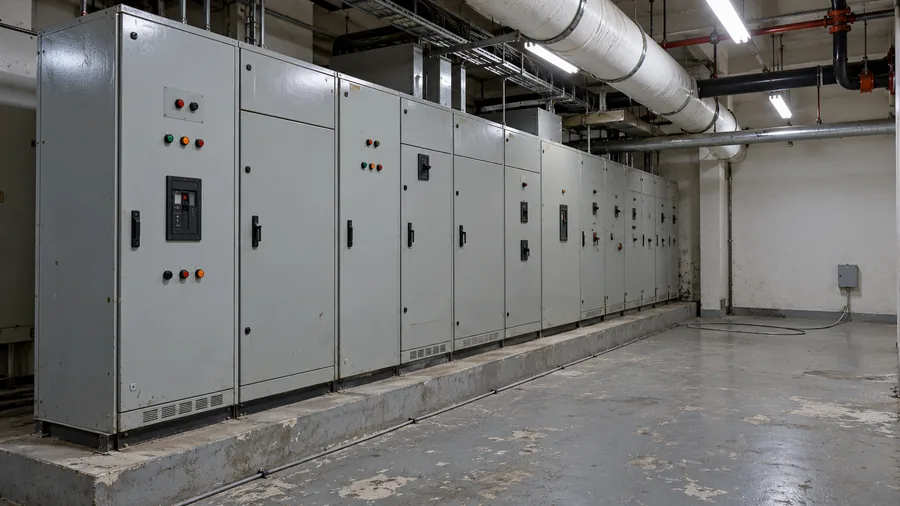
- Leak zones
Water near what water must not reach
Electrical rooms, under production lines and raised floors. The cable is laid in zones, so an alert says where the water is.
Heat at the panel connections that feed these machines? That is Thermal Risk: continuous temperature monitoring at the connections inside electrical panels.
Thermal Risk →See what changed since the last round.
Tell us which machines and areas worry you most. We'll reply with which signals to read, where, and how alerts would reach your team.